The macro moment: How protein and fiber are taking over America’s shopping carts
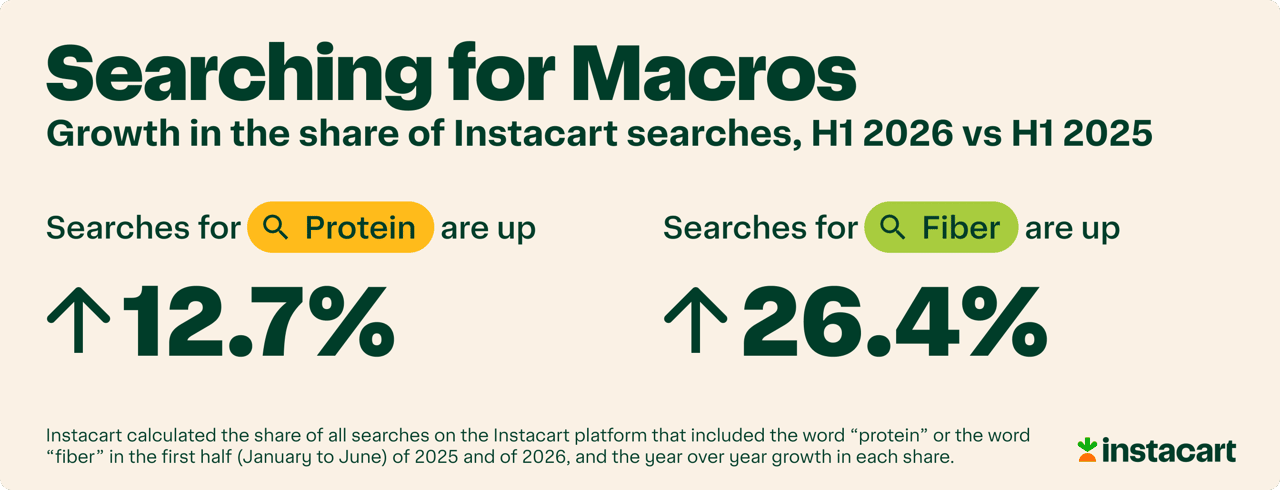
Instacart reports a surge in demand for protein and fiber, with searches for "protein" up 12.7% and "fiber" 26.4%,
Press Release Disclaimer: This is a press release distributed through the XPR Media network. It has not been independently verified by our newsroom.

The Image Party // Shutterstock
The macro moment: How protein and fiber are taking over America’s shopping carts
Walk down almost any grocery aisle in 2026, and the labels shout the same two words: protein and fiber.
Protein-maxxing and fiber-maxxing — newer terms coined by social media — are not happening in a vacuum. The rise of GLP-1 medications has pushed protein and fiber to the center of the national food conversation, as people on these drugs are widely advised to prioritize protecting muscle mass and supporting digestion. Grocers have taken note: Costco’s chief financial officer recently said “anything protein right now is doing extremely well,” and Meijer, in a press release, called fiber the “breakout nutrition goal for 2026.”
Instacart wanted to know how big the protein and fiber trend actually is — and where it’s showing up in shopping habits across the country — so the company dug into what people bought on their platform in the first half of 2026 and compared it to the same period in 2025.
To keep it honest, the company leaned on trusted nutrition sources to decide what genuinely counts as high in protein or fiber, including Mayo Clinic, Harvard’s Nutrition Source, and the Cleveland Clinic.
Key Takeaways
- Customers are asking for it by name. The share of Instacart searches containing the word “protein” rose +12.7% year over year, and “fiber” jumped +26.4%.
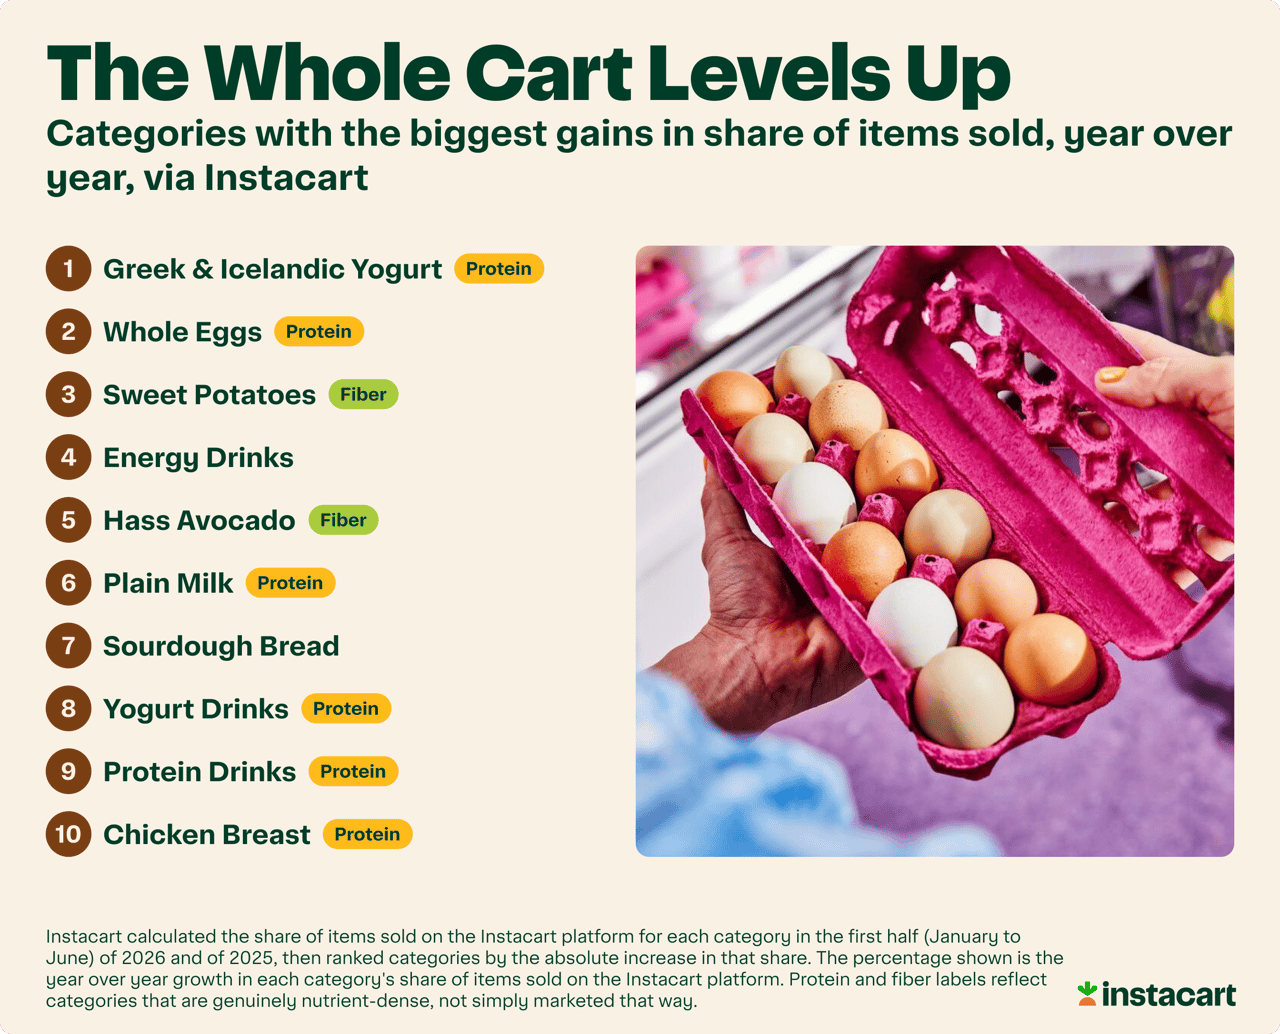
- Protein and fiber own the fast lane. Of the 10 categories that gained the most share of items sold in the first half of 2026, eight are high in protein or fiber.
- Canned sardines are the sleeper hit. Tinned fish — with top brands like Patagonia Provisions, Sea Castle, Sea Tales, and Fishwife — grew +51% year over year, the largest jump of any high-protein or high-fiber category on the list.
- People can’t get enough of grab-and-go protein snacks. Protein drinks rose +15%, protein bars +9%, and cottage cheese +10%.
- Fiber is booming, too. Sweet potatoes climbed +28%, frozen edamame +25%, and yams +20%.
- The south is fiber- and protein-maxxing. Among big cities, Austin buys +39% more fiber than the country as a whole, while protein-forward baskets cluster in places like Lakeland, Florida (+19%).
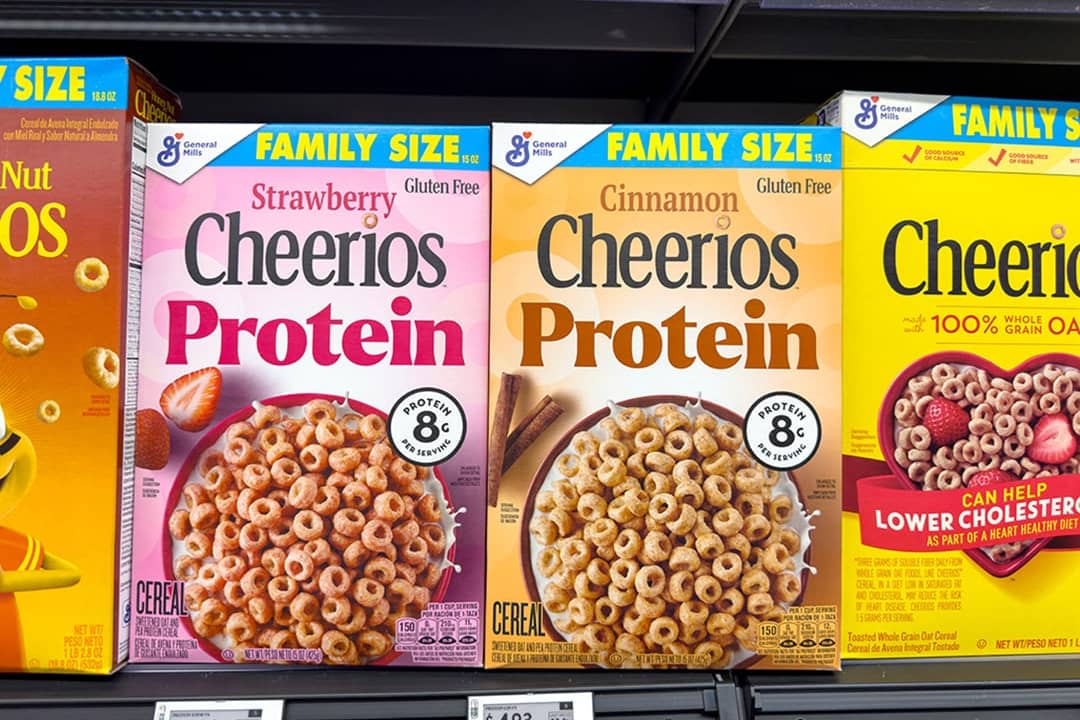
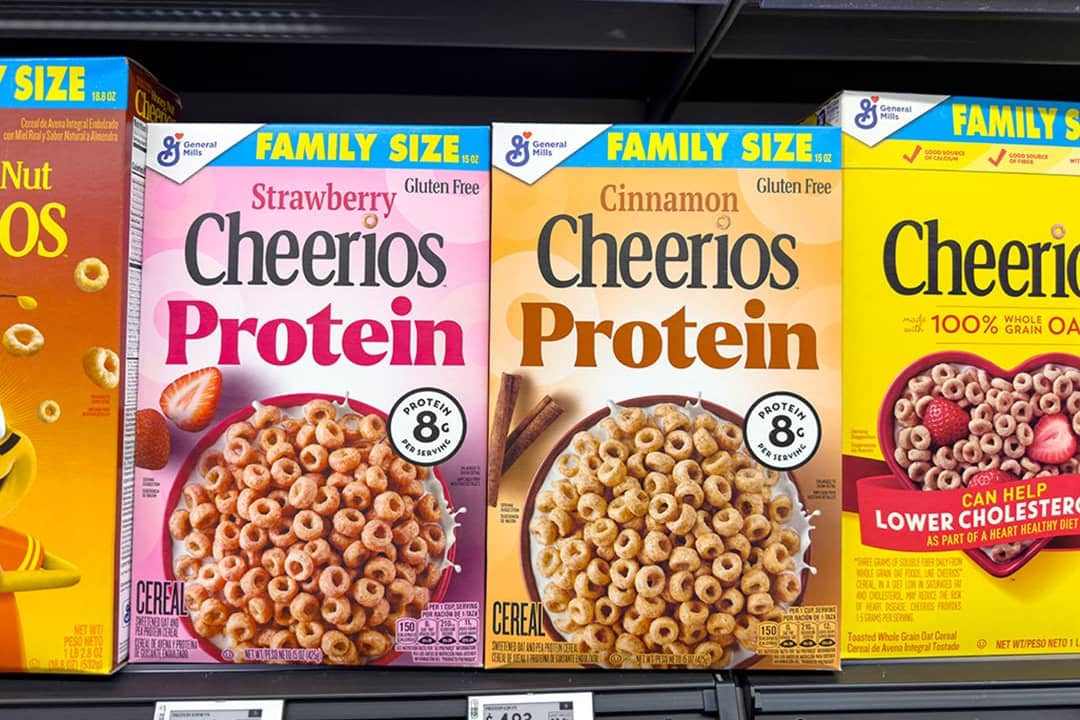
- Protein is moving into the center aisle. Cheerios Protein grew +157% year over year, and 2026 brought protein versions of everything from Doritos to Blue Bell ice cream and more.
1. It all starts in the search bar
Before something lands in a cart, it starts as a search — and search data is one of the clearest signals of where customer interest is heading. The share of searches that included the word “protein” grew +12.7% year over year, and “fiber,” from a much smaller base, grew even faster at +26.4%.
Instacart
2. The whole cart levels up
Of the 10 categories that gained the most share of all items sold, eight are high in protein or fiber. Greek and Icelandic yogurt (+8%) and whole eggs (+7%) are at the top, sweet potatoes are surging at +28%, and avocados (+6%), milk (+4%), protein drinks (+15%), and chicken breasts (+6%) aren’t far behind.
Instacart
3. The “protein-ification” of the center aisle
The surest sign that protein has gone mainstream?
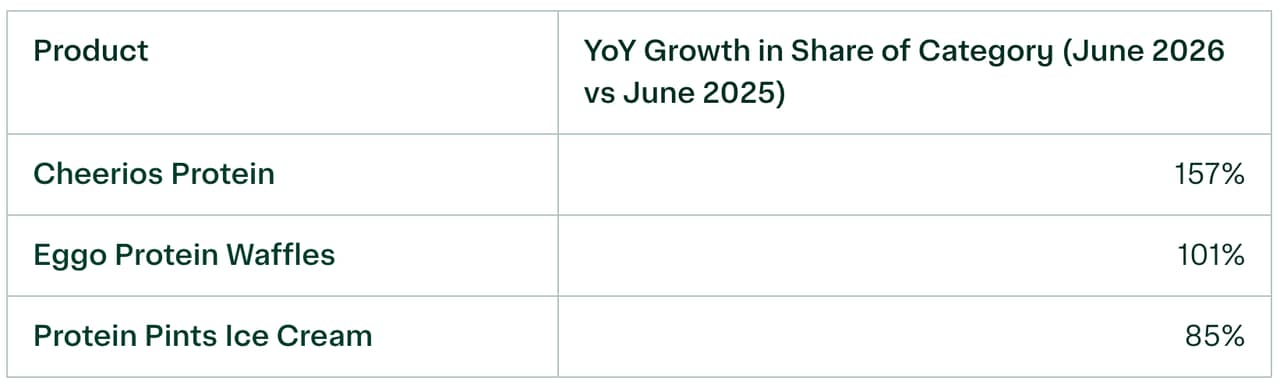
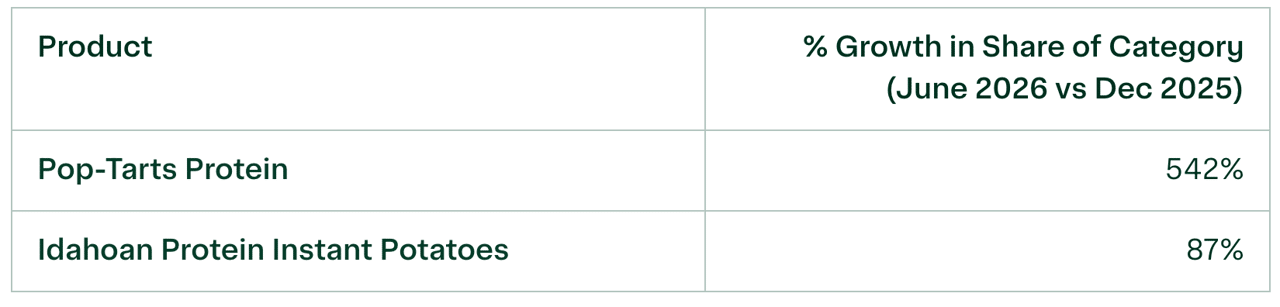
It’s showing up where you’d least expect it and signaling large-scale growth. Cheerios Protein surged +157% year over year in its share of the cereal category, Eggo Protein Waffles climbed +101%, and Protein Pints ice cream hit +85%. Of the protein-packed items introduced in the last six months of 2025, two iconic food brands saw meaningful gains over just six months: Pop-Tarts Protein (+542%) and Idahoan Protein Potatoes (+87%). People are clearly looking for ways to weave more protein into their everyday favorites, from beefing up breakfast staples to helping a dinner side dish staple pack a punch.
Instacart
Methodology: Year over year growth reflects the change in each product’s share of its category sold on the Instacart platform, comparing June 2026 to June 2025.
Instacart
Methodology: Percentage growth reflects the change in each product’s share of its category sold on the Instacart platform, comparing June 2026 to December 2025.
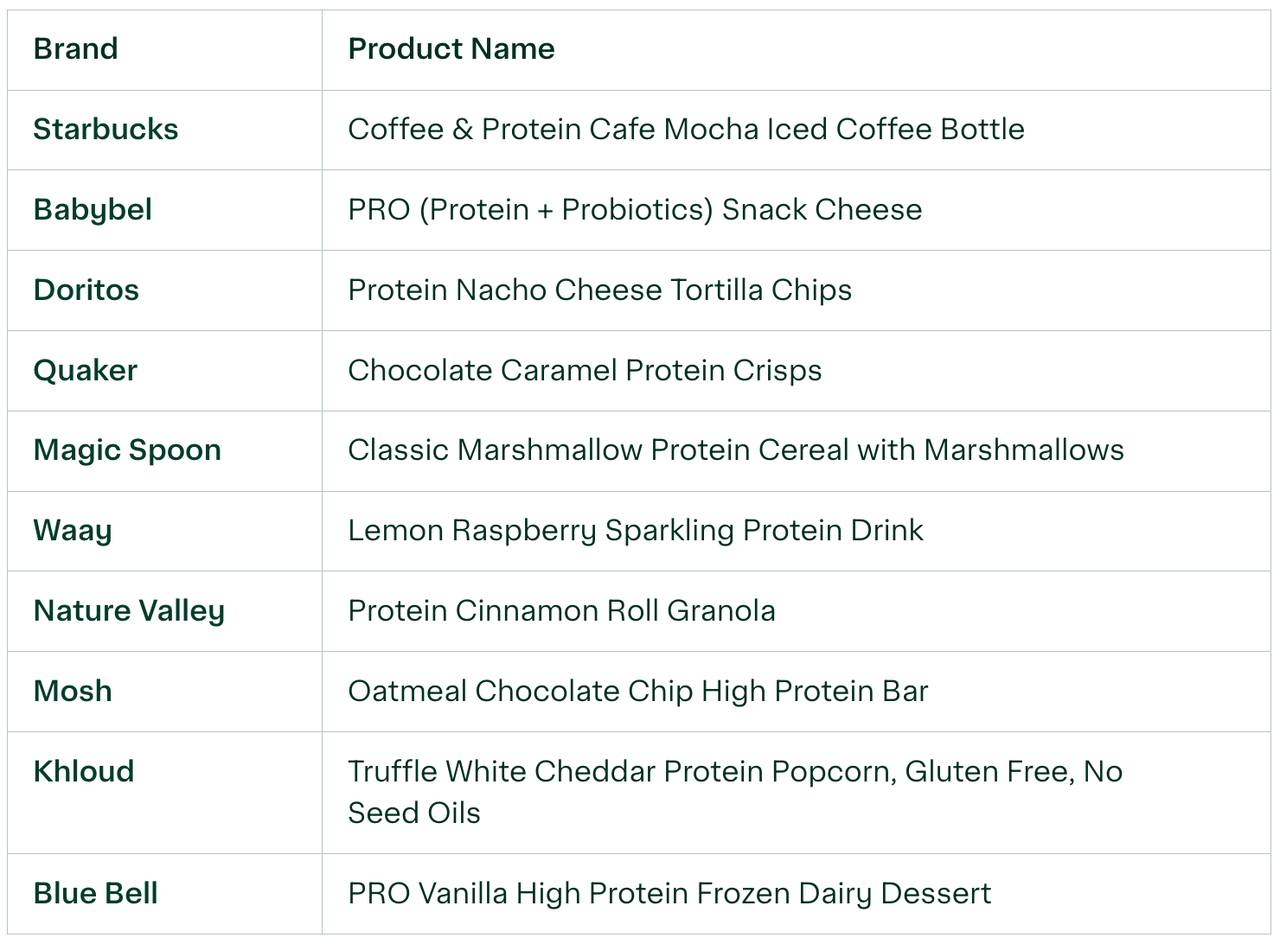
The even bigger story is the flood of brand-new arrivals, joining the protein pack this year. Everything from your morning coffee and movie-night popcorn to your sparkling water and after-dinner ice cream is getting the protein treatment. Here’s a sampler of protein-forward products that landed on Instacart’s digital shelves this year, proving that once a trend gets hot enough, no aisle is safe.
Instacart
Methodology: The 2026 launches are a selected sample of protein-forward products newly available on the Instacart platform this year, shown for illustration and not ranked.
4. Protein’s top gainers
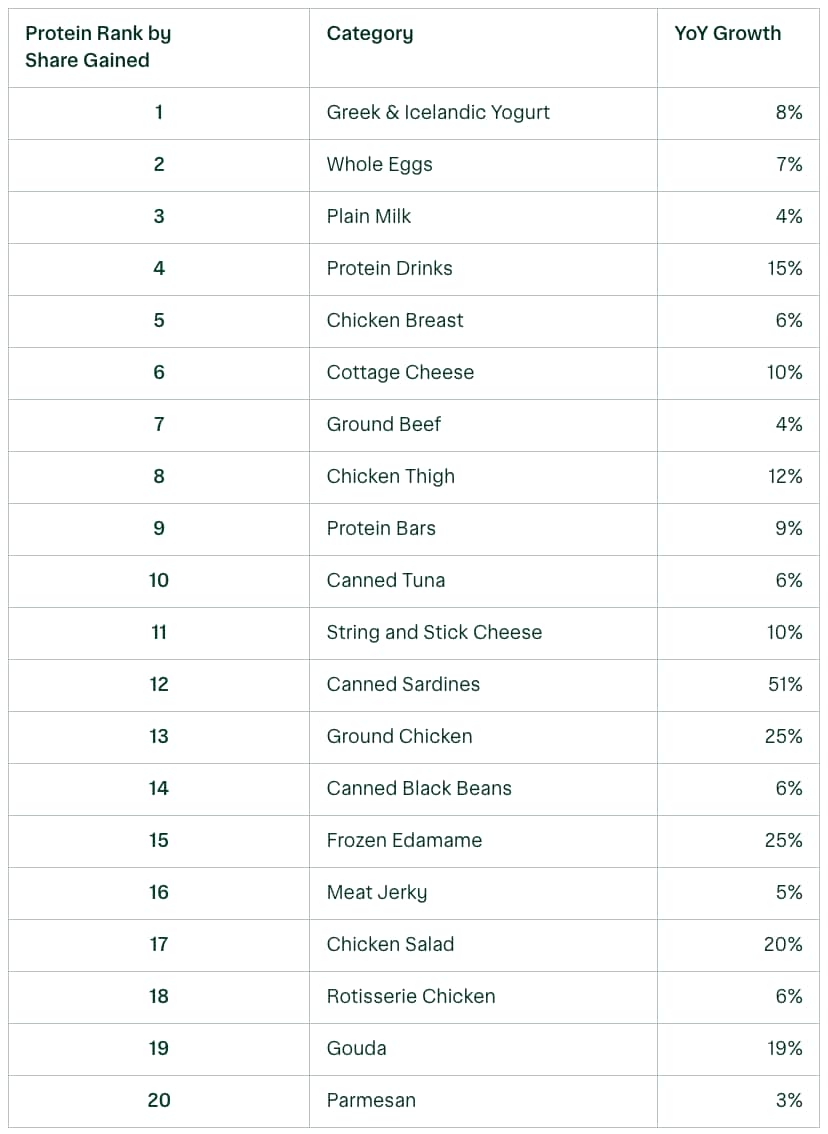
Protein is where the momentum runs deepest. These are the top 20 high-protein categories that gained the most share of items sold:
Instacart
Methodology: Instacart calculated the share of items sold on the Instacart platform for each category in the first half of 2026 and of 2025, and ranked the high-protein categories by the absolute increase in that share. The percentage shown is the year over year growth in each category’s share of items sold on the Instacart platform.
Familiar staples like Greek yogurt (+8%), eggs (+7%), milk (+4%), chicken breast (+6%), and cottage cheese (+10%) anchor the list, while fast risers — like canned sardines (+51%), part of the tinned fish movement — carry the list in terms of year over year growth.
Leading the tinned fish surge are brands like Patagonia Provisions (3,918%), Sea Castle (810%), Sea Tales (803%), and Fishwife (+68%).
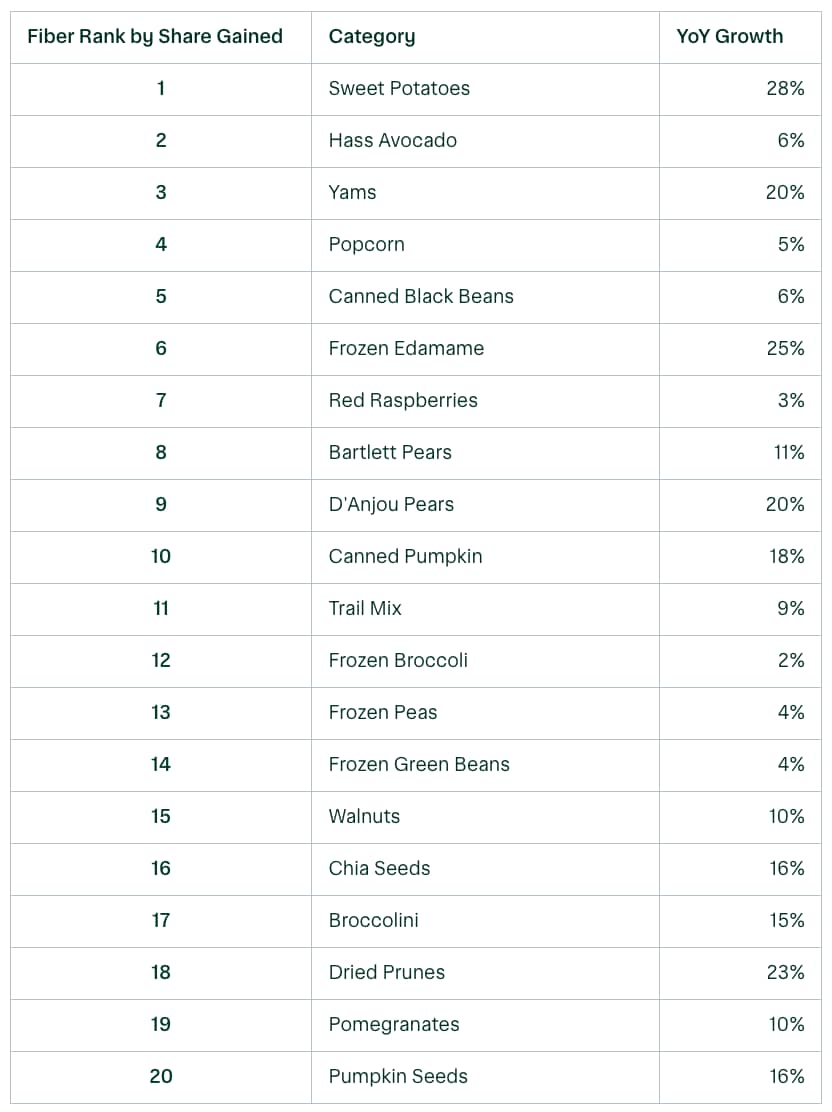
5. Fiber’s biggest movers
Fiber is having its own moment. Sweet potatoes lead the year over year growth charge at +28%, with frozen edamame (+25%) and dried prunes (+23%) close behind. What’s striking is the range – pears, pomegranates, Broccolini, chia seeds, pantry beans, and frozen vegetables. Fiber isn’t hiding in one aisle anymore. It’s everywhere.
Instacart
Methodology: Instacart calculated the share of items sold on the Instacart platform for each category in the first half of 2026 and of 2025, and ranked the high-fiber categories by the absolute increase in that share. The percentage shown is the year over year growth in each category’s share of items sold on the Instacart platform. One high-fiber category (White Corn) was set aside because its change reflected a very small base rather than a broad trend.
6. Where protein and fiber are winning — and where they’re not
Clear geographic patterns emerge when zooming out from individual categories and looking at all high-protein and high-fiber items combined.
One thing is for sure: No state embraces the macro moment quite like Florida, nationally ranking No. 1 for fiber and No. 2 for protein.
The midwest loves its protein — Iowa (+12%), South Dakota (+10%), and Nebraska (+9%) index near the top. While Florida bucks the trend (+10%), several coastal states trail the national average, including Hawaii (-14%), California (-11%), and Alaska (-8%).
.png)
Instacart
Fiber tells a different story: Florida (+17%), Colorado (+14%), and Washington, D.C. (+13%) lead the country, with a more even spread across the map.
.png)
Instacart
7. The cities that lean in hardest
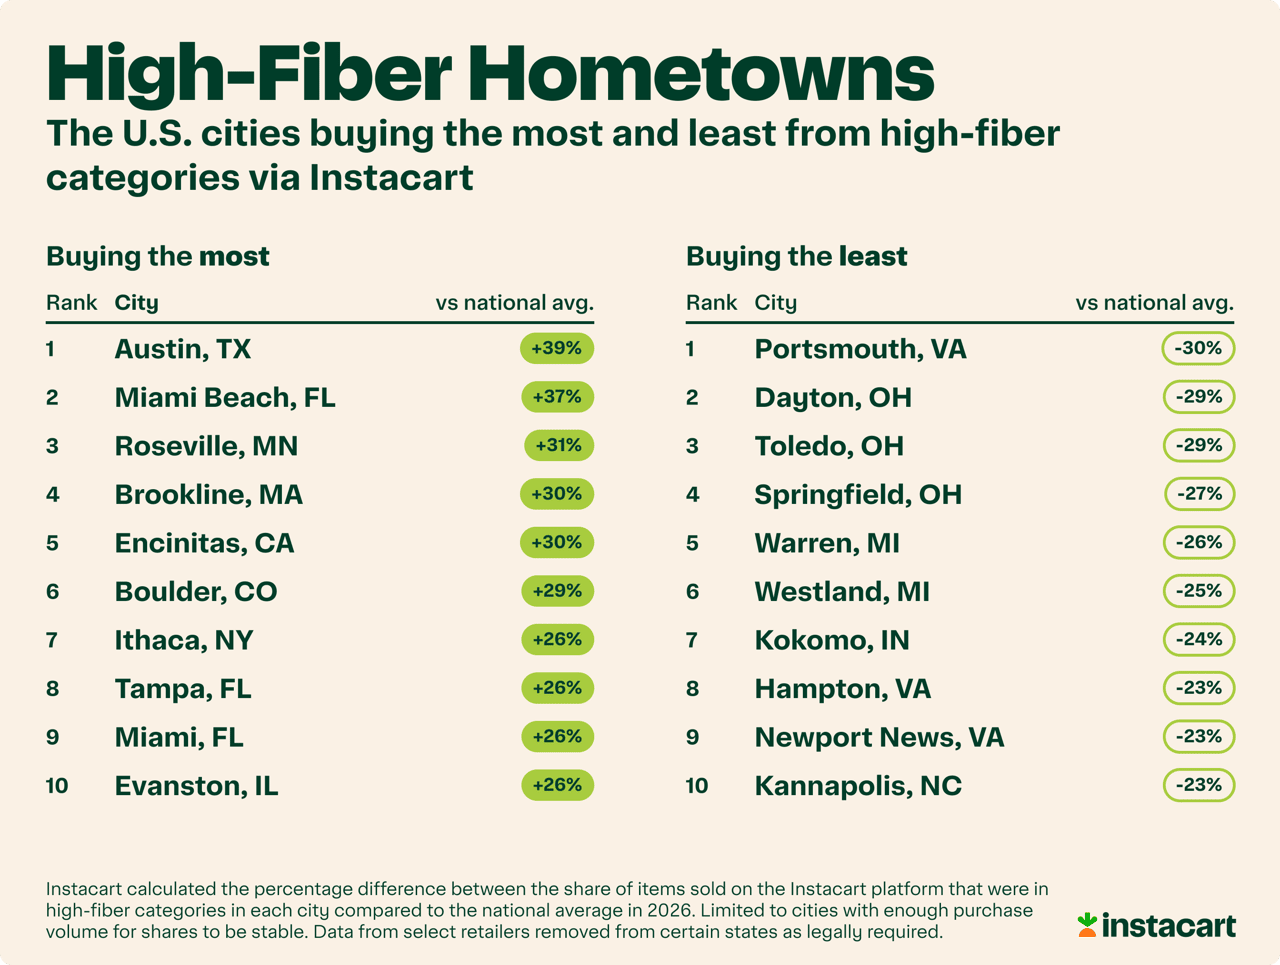
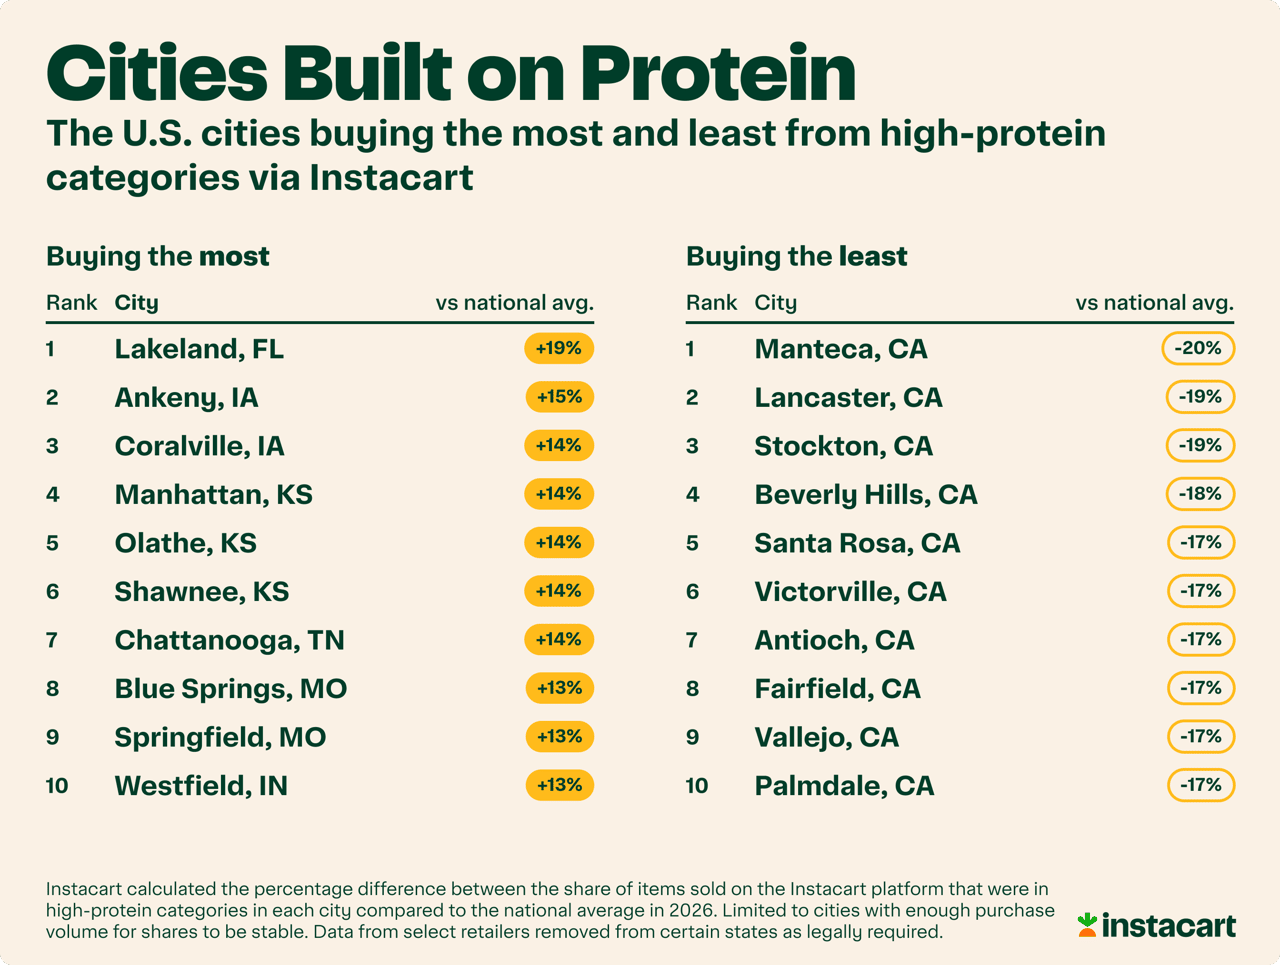
The city-level data is also where it gets fun. Austin, Texas, is America’s fiber capital (+39% above the national average), while Lakeland, Florida, leads the country on protein at +19%.
As for who’s skipping the protein trend, that would be California. All 10 of the lowest-indexing cities for protein are in the Golden State, from Manteca and Beverly Hills to Fairfield and Palmdale.
Instacart
Instacart
The macro moment is just getting started
The data doesn’t lie: Protein and fiber have moved from niche to norm.
What started in the supplement aisle is now in your cereal bowl, your ice cream pint, and your sparkling water. As GLP-1 adoption grows and more thoughtful shopping becomes the default, expect the trend to deepen to more categories, more cities, and more of the cart.
The macro moment is just warming up.
This story was produced by Instacart and reviewed and distributed by Stacker.